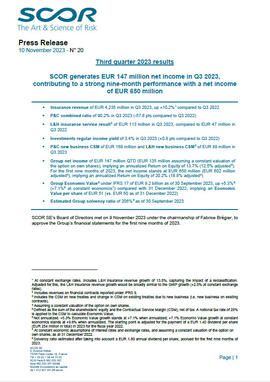
Insurance revenue of EUR 4,235 million in Q3 2023, up +10.2%1 compared to Q3 2022
P&C combined ratio of 90.2% in Q3 2023 (-57.8 pts compared to Q3 2022)
L&H insurance service result2 of EUR 113 million in Q3 2023, compared to EUR 47 million in Q3 2022
Investments regular income yield of 3.4% in Q3 2023 (+0.8 pts compared to Q3 2022)
P&C new business CSM of EUR 169 million and L&H new business CSM3 of EUR 89 million in Q3 2023
Group net income of EUR 147 million QTD (EUR 135 million assuming a constant valuation of the option on own shares), implying an annualized Return on Equity of 13.7% (12.5% adjusted4). For the first nine months of 2023, the net income stands at EUR 650 million (EUR 602 million adjusted4), implying an annualized Return on Equity of 20.2% (18.8% adjusted4)
Group Economic Value5 under IFRS 17 of EUR 9.2 billion as of 30 September 2023, up +5.3%6 (+7.1%6 at constant economics7) compared with 31 December 2022, implying an Economic Value per share of EUR 51 (vs. EUR 50 as of 31 December 2022)
Estimated Group solvency ratio of 206%8 as of 30 September 2023
SCOR SE’s Board of Directors met on 9 November 2023 under the chairmanship of Fabrice Brégier, to approve the Group’s financial statements for the first nine months of 2023.
Thierry Léger, Chief Executive Officer of SCOR, comments: “The results over nine months confirm SCOR’s focus on delivering its targets. On the P&C side, we are below our Cat budget over the first nine months of 2023, but continued attention is required on the attritional loss ratio. Our objective as we prepare the 1.1 renewals is to continue to take advantage of the hard market with new business generation at very attractive margins. In L&H and Investments, we deliver stable and positive results. With a EUR 602 million9 nine-month result, I see us well placed to deliver on our Forward 2026 plan.”
Group performance and context
SCOR records positive results in Q3 2023, a quarter historically marked by a strong claims activity:
In P&C (re)insurance, the combined ratio of 90.2% in Q3 2023 is driven by natural catastrophe losses above budget (including claims related to the Hawaii fires) and large man-made claims. Over the first nine months of 2023, the natural catastrophe ratio is below the budget. Overall, in Q3 2023, while the attritional loss ratio is satisfactory, the level of man-made claims is too high. SCOR continues its efforts to improve the core performance of its P&C business.
In L&H reinsurance, the business pursues its profitable growth and generates a consistent insurance service result of EUR 113 million2 in Q3 2023.
In Investments, SCOR benefits from high reinvestment rates and reports a noticeable increase in the regular income yield, which reaches 3.4% in Q3 2023 (vs. 3.1% in Q2 2023).
Over the first nine months of 2023, and assuming a constant valuation of the option on own shares, SCOR delivers a strong performance with a net income of EUR 602 million9, implying an annualized Return on Equity of 18.8%9, and grows its Economic Value by 7.1%10.
Footnotes:
1. At constant exchange rates. Includes L&H insurance revenue growth of 13.5%, capturing the impact of a reclassification. Adjusted for this, the L&H insurance revenue growth would be broadly similar to the GWP growth (+2.0% at constant exchange rates).
2. Includes revenues on financial contracts reported under IFRS 9.
3. Includes the CSM on new treaties and change in CSM on existing treaties due to new business (i.e. new business on existing contracts).
4. Assuming a constant valuation of the option on own shares.
5. Defined as the sum of the shareholders’ equity and the Contractual Service Margin (CSM), net of tax. A notional tax rate of 25% is applied to the CSM to calculate Economic Value.
6. Not annualized. +5.3% Economic Value growth stands at +7.1% when annualized; +7.1% Economic Value growth at constant economics stands at +9.6% when annualized. The starting point is adjusted for the payment of a EUR 1.40 dividend per share (EUR 254 million in total) in 2023 for the fiscal year 2022.
7. At constant economic assumptions of interest rates and exchange rates, and assuming a constant valuation of the option on own shares, as at 31 December 2022.
8. Solvency ratio estimated after taking into account a EUR 1.80 annual dividend per share, accrued for the first nine months of 2023.
9. Assuming a constant valuation of the option on own shares. Amounts taking into account the impact of the variation of the fair value of the option on own shares: net income of EUR 147 million and ROE of 13.7% in Q3 2023; net income of EUR 650 million and ROE of 20.2% in the first nine months of 2023.
10.Not annualized. Growth at constant economic assumptions of interest rates and exchange rates, and assuming a constant valuation of the option on own shares as at 31 December 2022. Economic Value defined as the sum of the shareholders’ equity and the Contractual Service Margin (CSM), net of tax. The starting point is adjusted for the payment of a EUR 1.40 dividend per share (EUR 254 million in total) in 2023 for the fiscal year 2022. Annualized Economic Value growth stands at +9.6% at constant economic assumptions of interest rates and exchange rates, and assuming a constant valuation of the option on own shares, as at 31 December 2022.


