Kyle
Amstrong
Protection R&D Leader

April 2, 2024
In November 2023, we shared our research into excess mortality at our “Navigating a Challenging Landscape” seminar, and it attracted a lot of discussion and interest. We have therefore decided to publish a summary in SCORacle.
In 2020, Covid-19 changed the world, increasing mortality rates across all ages. Although the increases seen for insured lives across 2020-21 weren’t quite as high as the population, they were close at +8% in 2020 and +12% in 2021 (Source: CMI WP176).
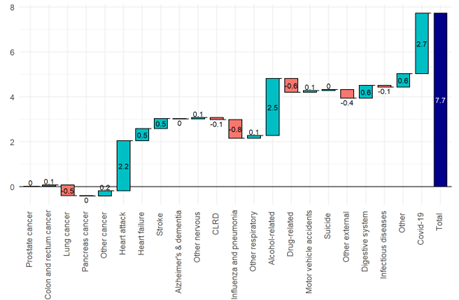
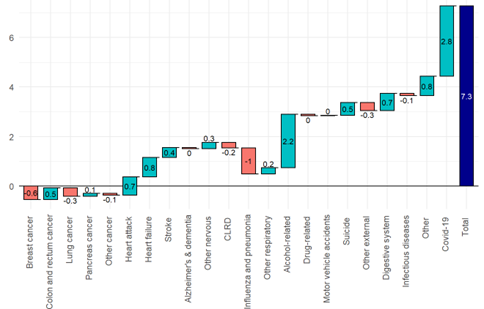
By 2022, the number of direct Covid deaths became significantly lower, signalling a return to normal. However, overall mortality remained high, suggesting there is much more to excess mortality than just direct Covid deaths. The actual mortality rate in 2022 was 7.5% higher than expected, thus resulting in excess mortality of 7.5% (7.7% for males, 7.3% for females). We then calculated excess mortality for each cause of death using this same method, enabling us to split the total excess mortality by cause of death in the waterfall charts below.
Excess mortality statistics are widely available online, however there are vast differences in the baseline used to calculate expected claims. The mortality from 2019 and pre-pandemic averages are most common, however these are susceptible to volatility and don’t allow for the improvements we would expect since. In addition, the publicly available figures are driven by mortality rates at older ages, whereas our insured portfolios are weighted more towards younger lives.
At SCOR, we used mortality data for England from the Office for National Statistics (ONS) to calculate excess mortality. We estimated expected mortality for 2022 by projecting forward pre-pandemic mortality rates, therefore allowing for mortality improvements. This was done for Protection ages, therefore giving a result more relevant for insured lives.
Excess mortality in England by cause of death - Males

Excess mortality in England by cause of death - Females

Cardiovascular and Alcohol-related cause of deaths are the most significant causes of non-Covid excess mortality for both males and females.
Our view is that the primary causes of the cardiovascular excess mortality are post-Covid sequelae and the NHS pressures resulting in delays to emergency treatment.
A recent study of US veterans (Source: Nature) estimated an increased heart attack risk of 63% within the first year of Covid infection, relative to someone of equivalent age and health who had not been infected. Fortunately, this additional risk reduces significantly after the first 6 months. It also disappears completely within a year when the Covid infection wasn’t severe enough to result in hospitalisation.
This increased risk has come at a time when the NHS has been most under pressure from staffing and funding, resulting in significant delays to ambulance response times. Suspected heart attacks and strokes are prioritised by ambulance services as Category 2. The average response time for Category 2 incidents increased from 23 minutes in 2019 to 53 minutes in 2022. This increase was caused by intense staffing shortages and fewer available hospital beds, all exacerbated by Covid control measures.
A 2018 Hospital study estimated that a 10 minute delay to hospital treatment results in a 58% increase to heart attack mortality, demonstrating the importance of just a few minutes.
By January 2024, the average response time for category 2 incidents has improved to 40 minutes showing that improvements have been made, but this is still significantly above pre-pandemic performance levels. The NHS target Category 2 response time has been increased to 30 minutes to reflect the new lower performance levels, but there is still some way to go before this is met.
The alcohol-related excess mortality relates mainly to alcoholic liver disease. Alcohol-related accidents are classified elsewhere.
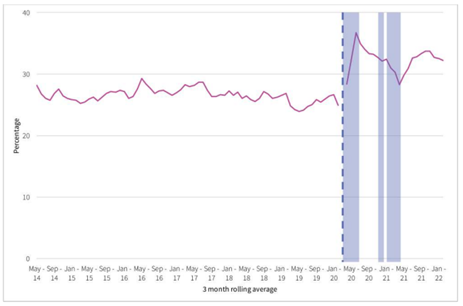
The 2022 excess mortality for alcohol-related causes coincides with a large increase in the percentage of people drinking at high risk levels from 2020 onwards, reported by the Institute of alcohol studies.

This pattern strongly correlates with the increase in the alcohol related population mortality in each year from 2020.
Due to the protective effects of underwriting, alcohol-related mortality contributes to only 1% of claims, therefore this trend is unlikely to be significant for insured lives.
The non-Covid excess population mortality in 2022 was higher than anyone had predicted, and we have already started to see this excess emerge for insured lives. However, with a more detailed understanding of what’s driving this excess, combined with continued monitoring of experience, we can be better prepared for the road ahead.
With the change in drinking patterns since the pandemic it is important that we continue to adapt application questions to ensure that we get better disclosure around alcohol consumption and any alcohol related conditions. Alcohol has always featured high on the list of causes of misrepresentation, possibly due to the social stigma associated with it.
Can we improve disclosure around alcohol consumption during the application process? There are numerous ways to ask the same question and insurers have different questioning formats which can yield different disclosures. Using a behavioural science approach to redesigning the question has shown improved disclosure while reducing social stigma associated with alcohol. The approach is to make it easy for the applicant to be as honest as possible and to frame the question in order to reduce the sense of social stigma.
These are some findings from a study carried out by SCOR in the United States comparing disclosures for a typical application question regarding alcohol consumption to a new question designed using a behavioural science approach.
| Question Format Type 1 | Question Format Type 2 |
|---|---|
| Do you currently drink alcoholic beverages? | In the last 10 years, how often have you consumed alcoholic beverages? (The study included a range of options to capture all experiences) |

Question Type 1
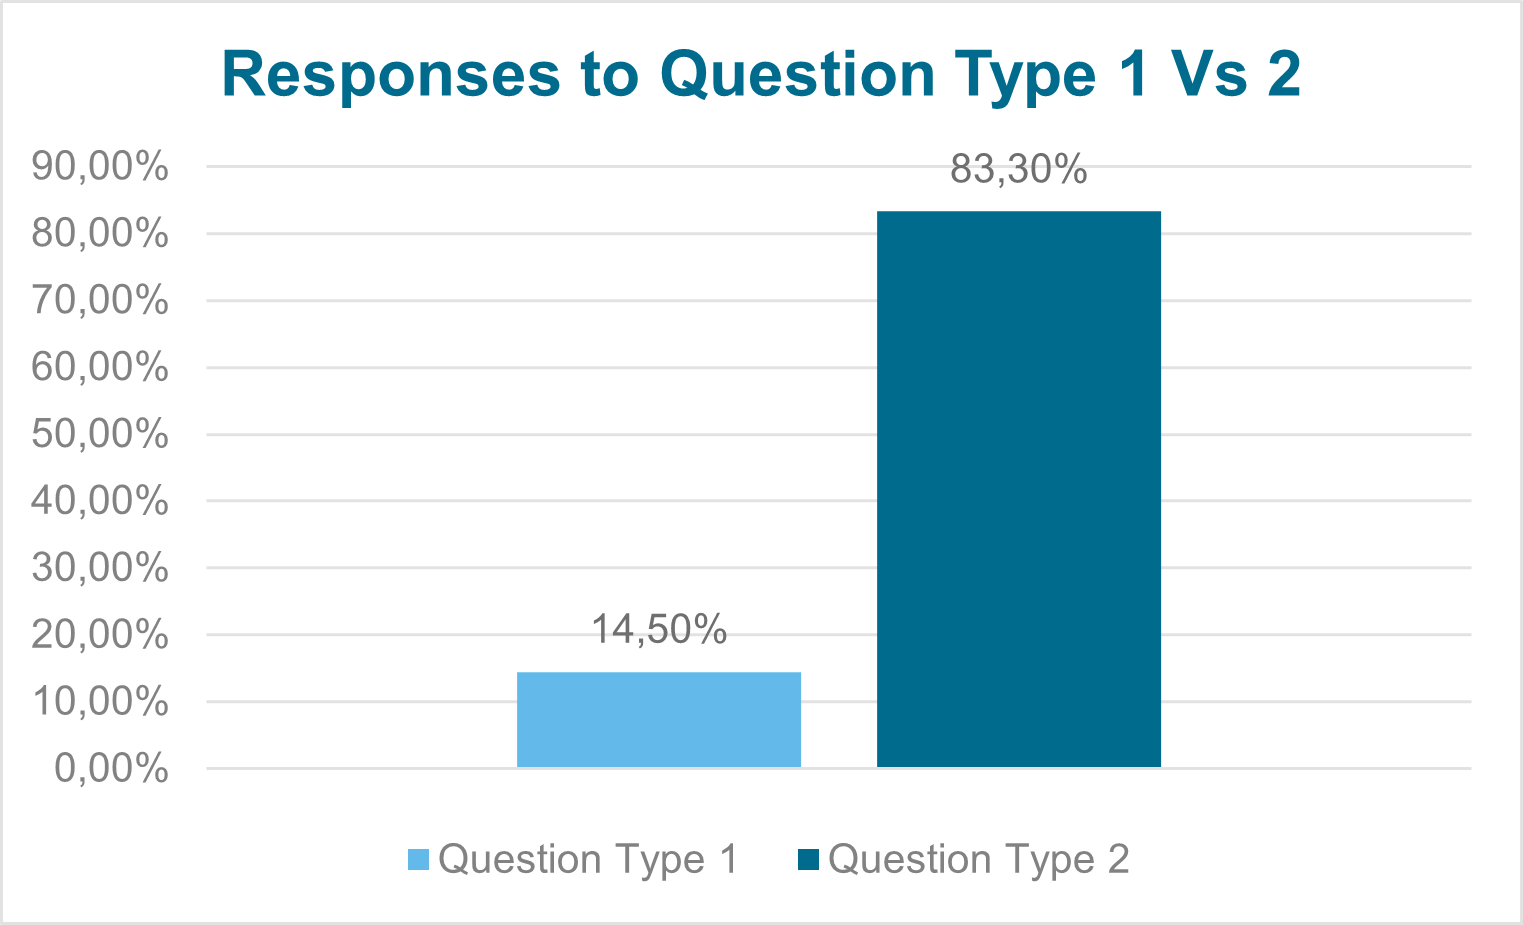
14.5% of applicants answered positively to the standard type question used on many application forms
Question Type 2
83.5% ticked one of the options provided indicating that they drink / drank alcohol. This is closely aligned to the population consumer statistics in the US.
*In 2021 84% of adults in the US reported that they drank alcohol at some point in their lifetime.
Using the example above; In Question type 1 the applicant decided for themselves whether their alcohol consumption warrants answering the question ‘yes’ or ‘no’. However, this yes / no option can highlight alcohol use as a negative behaviour that the applicant needs to admit to.
However, Question type 2 already assumes that everyone consumes alcohol and asks how often it is consumed. The only way to answer ‘no’ is to choose the option – I have never drank alcohol. The disclosure for Question type 2 is significantly higher than for 1 and is closely aligned to the population consumption statistics in the United States*.
By using the format in Question Type 2, this allows for further questioning regarding the applicant’s consumption. Whilst most applicants will be accepted at standard rates, this enables the underwriter to make the judgement regarding what details are required, rather than the application making this decision.
Getting better disclosures at the point of sale and reducing misrepresentation will ensure that customers are on risk on the correct terms and reduce issues at the time of a claim. For claims assessors, this should help avoid issues in dealing with concerns about misrepresentation of factors related to lifestyle. However assessors should be vigilant and carefully consider claims where misrepresentation of excessive alcohol consumption may be a factor.
CONTACT
OUR EXPERTS

Kyle
Amstrong
Protection R&D Leader

Catherine
Lyons
Underwriting & Claims Development Manager