
- FR
- EN

SCOR in partnership with the Society of Actuaries (SOA) completed an experience study of post-level term (PLT) life insurance lapse and mortality, U.S. Post-Level Term Lapse and Mortality Experience. PLT lapse and mortality have previously been analyzed in SOA PLT studies conducted in 2010 and 2014. This study provides an update of experience and some valuable new insights. In addition to the report, interactive tools developed in Tableau were also created to help users further explore specific variables and policy characteristics that are of most interest to their business.
New to the 2021 study are more lapse and mortality data including additional durations of PLT experience. Additional data, not previously analyzed, have been collected with this study including policyholder billing type and more precise premium information which includes policy fees instead of only premium rates. This is also the first study to include PLT experience for 20-year term plans (T20).
In addition, this is the first PLT study that provides lapse and mortality analysis for the Graded PLT premium structure. Prior studies focused on the Jump to ART PLT premium structure, which is the most common structure for the U.S. term market. Jump to ART is characterized by a large increase in premiums at the end of the level term period followed by premiums that increase annually on an ART scale.
In more recent years, the Graded PLT premium structure has become popular. Graded PLT premium structures tend to have a linear grade between the level period and an ultimate ART premium scale over a defined number of years. This produces lower initial premium jumps but more significant jumps during the grading period.
Overall, the findings of the prior studies are validated with this new study. However, with additional data available, this new study was able to provide further insights compared to the prior studies.
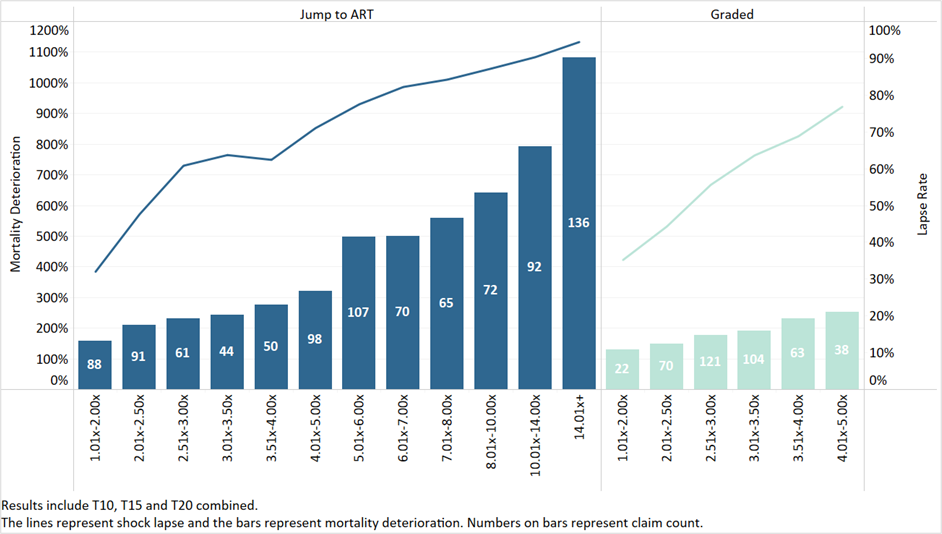
The results of this study were compared to the prior study completed in 2014. Premium increase continues to be the most important factor impacting shock lapse and mortality deterioration with higher premium increases resulting in higher shock lapse and mortality deterioration. See Figure 1 below showing the shock lapse and initial mortality deterioration for both Jump to ART and Graded structures.
Figure 1 - Shock Lapse in PLT Duration 0, Mortality Deterioration in PLT Duration 1 by Initial Premium Jump and PLT Structure
When comparing the Jump to ART results, the pattern of post-level term lapses and mortality deterioration generally aligned with the prior study with a declining pattern after the initial shock lapse which levels out after three to five post-level term durations. The magnitude was also very similar with small differences attributed to differences in business mix.
Graded structures are designed to have a lower initial premium jump with the objective to reduce the anti-selective lapses at the end of the level term period. The Graded design led to a lower range of premium jumps and, as a result, lower shock lapse and initial mortality deterioration as seen in Figure 1 above. Still, for a given initial premium jump, the shock lapse and initial mortality deterioration are similar between structures.
The pattern of lapse by duration in post-level term, seen for Graded for the first time in the latest PLT study, shows key differences compared to Jump to ART results. See Figure 2 below.
Figure 2 - Lapse by PLT Duration, Initial Premium Jump Group & PLT Structure
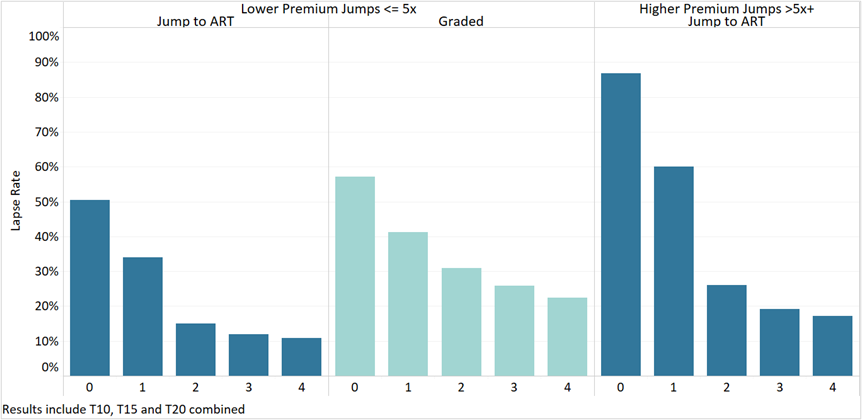
Comparing the structures over the same premium jump range in the first two panels in Figure 2, shock lapses were similar, but higher lapses were observed for Graded in all four PLT durations for which Graded data were available. Upon further investigation, this difference can be attributed to the premium increases in each year in PLT. While the Graded structure has lower initial premium jumps, the premiums continue to step up significantly each year. The higher lapses in PLT are a reaction to these subsequent premium increases. In the study, two new premium jump variables are considered in addition to the initial premium jump at the end of the level term period:
Including the subsequent premium increase as a variable can explain the difference between the structures and help set an appropriate Graded lapse rate for different grading patterns.
Mortality deterioration by PLT duration also showed variation between the two premium structures, even when compared over similar premium jump ranges. See Figure 3 below.
Figure 3 - Mortality Deterioration by PLT Duration, Initial Premium Jump Group & PLT Structure
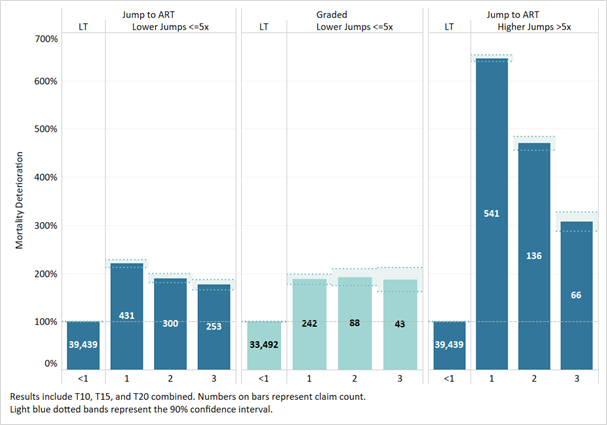
The pattern for Jump to ART is familiar from prior studies where the worst mortality deterioration is experienced in the first year following the shock lapse and mortality deterioration reduces rapidly by year thereafter. Over the lower premium increase ranges common to both structures, Jump to ART and Graded showed similar levels of mortality deterioration in the first year in PLT.
However, Jump to ART showed a decreasing pattern of mortality deterioration by duration, while mortality deterioration stayed relatively level for the three PLT durations for Graded. This is the first insight into mortality deterioration for the Graded premium structure. This pattern of mortality deterioration is consistent with the higher lapse rates observed in the subsequent PLT durations for Graded. Higher premium jumps in each duration in PLT lead to higher anti-selective lapses.
This appears to offset the decline in mortality deterioration that is seen on the Jump to ART experience resulting in a level pattern of mortality deterioration in the post-level term for Graded. In Figure 2 and Figure 3, it is also possible to compare Graded over the lower premium jumps to Jump to ART over the higher premium jumps, which are the most commonly considered PLT premium designs. A comparison between the structures requires close consideration of both the lapse and mortality differences to calculate projected premiums and claims under different premium structures.
A comparison of results by term plan showed lapse experience at the end of the level term period and lapse rates in PLT appear very similar between T10 and T15. Though only initial lapse and mortality experience was available for T20, the relationships were similar to the other term plans. See Figure 4 below.
Figure 4 - Shock Lapse by Initial Premium Jump & Term Period
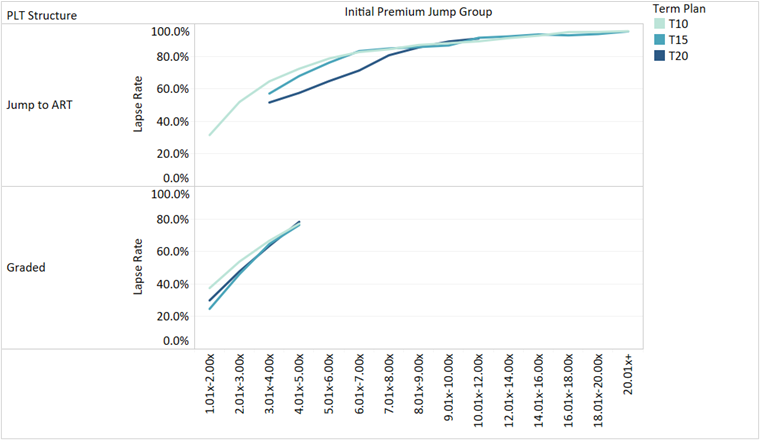
Mortality deterioration was also similar but less credible with only 104 claims in the first PLT duration for both Jump to ART and Graded plans combined.
Many factors in addition to premium increase have an impact on the lapse and mortality experience. Results can be reviewed by many factors using the online interactive tools published alongside the full report.
In addition, statistical modeling techniques were applied to provide insights into the predictive value of each factor. Premium increase, attained age, and billing type were identified as important factors in both the lapse and mortality analysis. Premium mode was also important for lapse analysis, while risk class was important for mortality analysis.
Shock lapses increase as attained age increases within a given premium jump ratio. The level term premium is greater for higher issue ages and as a result the same premium jump ratio corresponds to a larger dollar amount of premium increase at older ages, which may be a reason for the higher shock lapse.
Policies with a monthly premium mode had a much lower shock lapse than policies with an annual premium mode, even when the premium jump ratios were the same. More policyholders were willing to accept the increase when presented as smaller, more frequent premium payments (monthly) compared to one large payment (annual).
Billing type was a new variable in this study shown to impact policyholder behavior. See Figure 5 below.
Figure 5 - Shock Lapse by Initial Premium Jump, Billing Type & PLT Structure
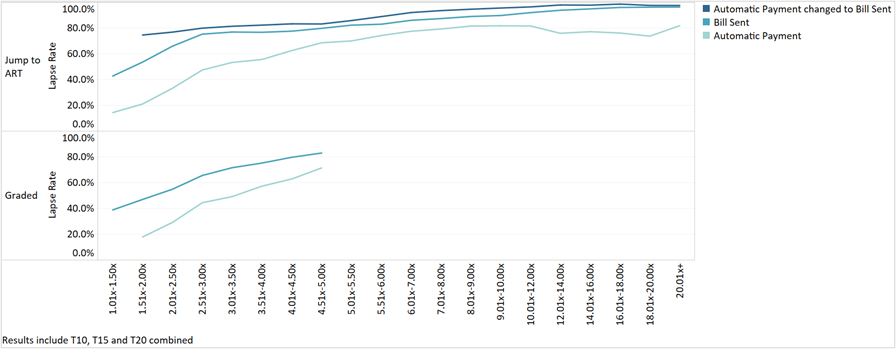
Policies that pay premiums under automatic payment had lower shock lapses than policies that receive a bill for premiums due. Furthermore, when the billing type changed from automatic payment during the level term period to a bill sent for PLT premiums, the highest shock lapse was observed.
Similar relationships were also observed for mortality deterioration. Initial mortality deterioration is higher when premium increase is higher. There is also an increasing relationship with attained age. Mortality deterioration is higher when PLT premium is paid annually and when the billing type changed from automatic to bill sent.
Another interesting factor is risk class. Mortality experience differs in PLT depending on the premium structure. See Figure 6 below.
Figure 6 – Initial Mortality Deterioration by Risk Class & PLT Structure
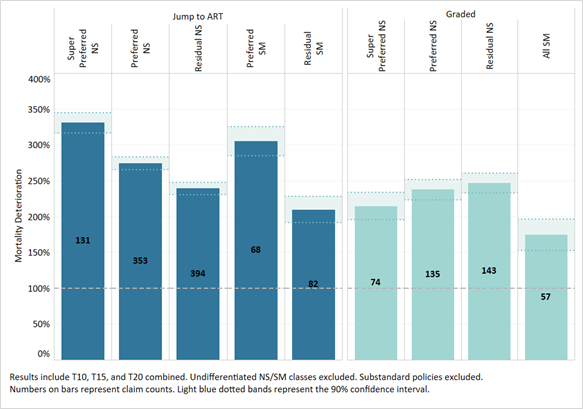
For Jump to ART, initial mortality deterioration is higher for super preferred and preferred classes, as shown in Figure 6. This pattern was also observed for shock lapse. Generally, Jump to ART PLT rates do not vary by risk class and PLT rates vary only by smoker/non-smoker. This leads to higher premium jumps for the preferred classes that face a larger jump from their lower level term premium to the non-smoker post-level term rate.
Graded PLT premiums vary by risk class, at least during the grading period. Figure 6 shows less variation for Graded, but mortality deterioration appears slightly higher for residual classes. We can conclude that the driver of the mortality deterioration patterns observed is the difference in premium jumps which leads to differences in shock lapse. However the comparison between the PLT structures highlights the impact of varying PLT premium by risk class on the business profile in PLT. More generally, this highlights that varying PLT rates by more factors can impact the business mix in PLT.
Lapse and mortality experience by duration in PLT can also be analyzed in detail using interactive tools published alongside the full report. For Jump to ART, the PLT lapse and mortality experience is available for 10 durations. The same factors that impact shock lapse continue to have an impact by duration in PLT, though the range becomes narrower by duration.
An additional driver to consider is the impact of premium increase in subsequent durations in PLT, which helps explain the difference between Jump to ART and Graded structures. The mortality deterioration by duration can be analyzed by multiple factors to provide insights into the wear-off pattern for Jump to ART as well as an initial look at the pattern emerging for Graded mortality in PLT.
The pattern of lapse in PLT is an important consideration to understand the PLT premiums paid in each year. There is a clear lapse skewness pattern with lapses occurring towards the end of the last duration in the level term period and the beginning of the first duration in PLT. This pattern is more pronounced for the more frequent premium modes. When premium was paid monthly, more of the lapses in the first duration in PLT occurred in the early months of the policy year. The PLT duration 1 skewness also varied between PLT structures. Graded lapses show a skew to the start and also to the end of PLT duration 1 due to the significant subsequent duration PLT premium increase.
In the shock lapse analysis, monthly premium mode policies showed lower shock lapse than annual premium mode policies. Looking at experience in PLT, persistency analysis is needed to identify if monthly mode policyholders actually paid more premium in PLT. Over some premium jump ranges, the lapse in the first duration in PLT was similar or somewhat higher for monthly mode compared to annual mode.
A cumulative persistency analysis, calculating persistency at the end of first duration in PLT showed more monthly premium mode business remained in force than annual premium mode over a variety of initial premium jump ranges. This confirmed that the lower shock lapse for monthly premium mode business does not only lead to more policyholders paying one month of premium in PLT, but better persistency to end of the first year in PLT.
Due to the skewness patterns, a cumulative persistency analysis can provide more detailed insights when comparing PLT premium paid under different structures and premium modes.
There is a clear correlation between shock lapse and mortality deterioration as factors that lead to higher lapses also lead to higher mortality deterioration. The new 2021 study confirms from prior studies that the main driver of shock lapse and mortality deterioration is the premium increase and provides additional insights into how policyholder behavior is impacted by the way the premium increase is presented in terms of billing type and premium mode.
A first look at T20 results found the initial experience to be similar to T10 and T15. Comparisons of the Jump to ART and Graded structure provide additional insights for both structures and where differences are identified, premium jumps, including subsequent duration premium jumps in PLT, are the key drivers.
If you are interested in learning more about these findings, the full report can be found on the SOA website.
In addition to the report, online interactive tools are also available to further explore variables and policy characteristics impacting post-level term mortality and lapse experience. Please feel free to reach out to the report authors with any questions you may have regarding the findings.

