Financial performance

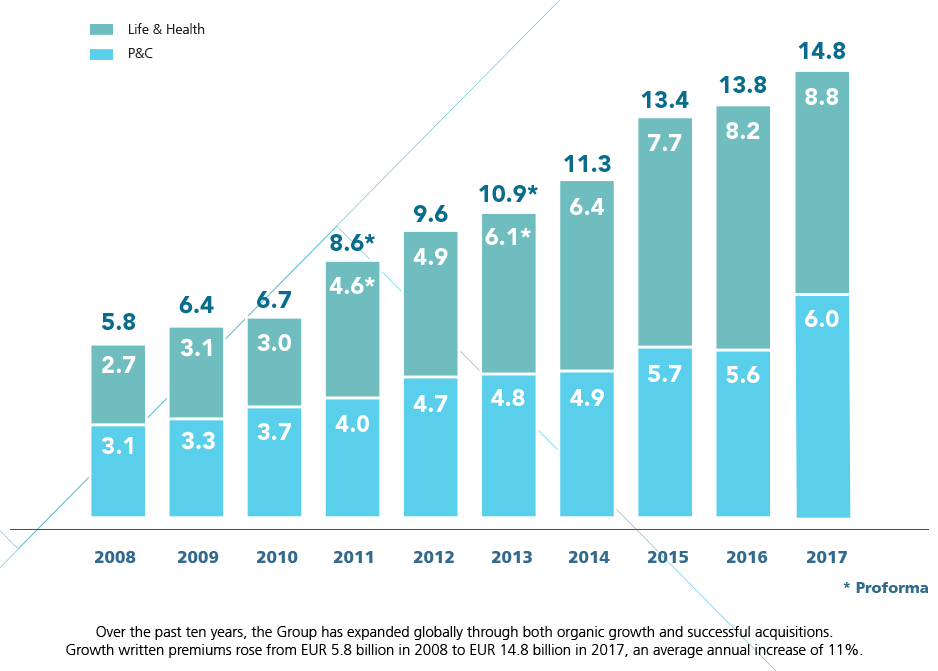
SCOR delivered a strong start to its “Vision in Action” strategic plan, which began in 2016. The Group deepened its presence in the local Non-Life and Life markets in which it operates by strengthening client relationships and through best-in-class services and product innovation. It further developed the Non-Life U.S. franchise and expanded in Life fast-growing Asia-Pacific markets through organic growth. SCOR delivered a strong set of results in 2017 and continued to grow while successfully combining profitability and solvency.
 14.8
BILLION EUROS Gross
14.8
BILLION EUROS GrossWritten Premiums
 286
MILLION EUROS
286
MILLION EUROSNet income
43.2
BILLION EUROSBalance Sheet
(as at 31/12/2017)
6.2
BILLION EUROSShareholders’ Equity
 94.3%
Normalized P&C Combined ratio (103.7% actual)*
94.3%
Normalized P&C Combined ratio (103.7% actual)*
 7.1%
LIFE TECHNICAL MARGIN
3.5%
RETURN ON
7.1%
LIFE TECHNICAL MARGIN
3.5%
RETURN ONINVESTED ASSETS
10.1%
Normalized Group ROE (4.5% actual)*
213%
Year-end 2017 Solvency ratio**
* See details of the normalization calculation in the 2017 financials presentation.
** Solvency ratio based on Solvency II requirements. The Group solvency final results are to be filed to supervisory authorities by June 2018, and the final Solvency ratio may differ from this estimated ratio. This estimate was prepared on the basis of the business structure in existence at December 31, 2017 and tax assumptions consistent with those applied to the 2017 annual IFRS Group financial statements.
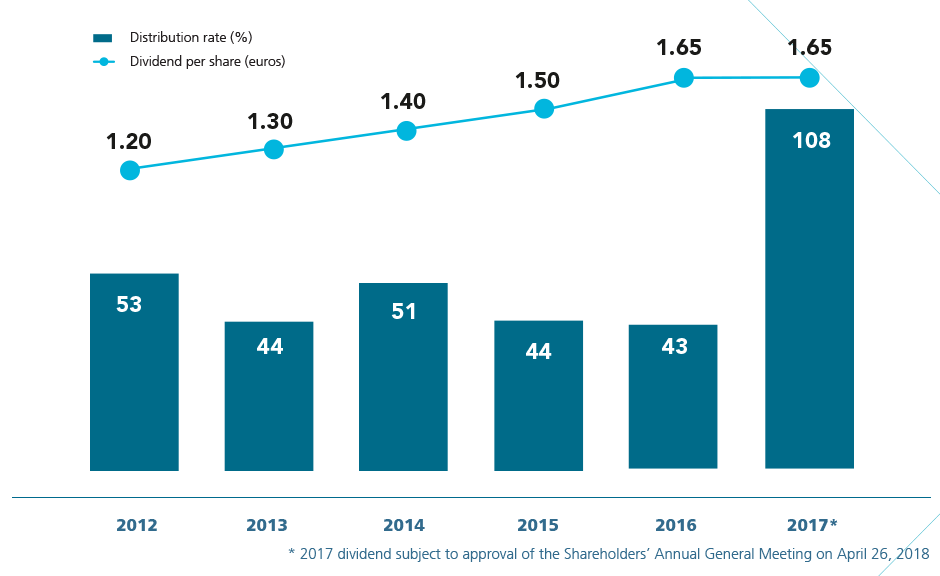
SCOR aims to remunerate shareholders through cash dividends, and if relevant, does not exclude special dividends or share buy-backs. Overall the Board will aim to maintain a minimum dividend payout of 35% over the cycle, while pursuing low variation in the dividend per share from year to year.
A CONSISTENT SHAREHOLDER REMUNERATION POLICY
GEOGRAPHICAL SPLIT
OF 2017GROSS WRITTEN PREMIUMS
A WELL DIVERSIFIED GROUP
2017 GROSS WRITTEN PREMIUMS
EVOLUTION OF GROSS WRITTEN PREMIUMS SINCE 2008 (in €bn)